Customize Reports
Each report is built with a default set of columns arranged in a specific order. You can customize your reports in several ways:
- Change the order that columns are displayed
- Sort by a single column or by multiple columns
- Exclude columns in the report or include columns not present
- Show subtotals and grand totals
- Move a column outside of the table to create multiple tables
This chapter covers the above customizations. In the next chapter, Work Efficiently, we'll discuss how you can save your customizations for future use.
Move Column Left or Right
There are two ways to move a column to the left or right: 1) use the menu or 2) drag and drop.
Menu: With your mouse on the heading of the column you want to move, right-click the mouse. Select Move Column \ Left (or Right) from the quick menu.

Drag & Drop: When you hover your mouse above the column heading, the four-headed arrow appears. Now you can drag the column to where you want it and release the mouse button to drop it in place. As you drag the column, notice the light blue shading that appears in the data table; this indicates where the column will be placed when you release the mouse button.

Sort Data
The sort order for reports in the Financial dashboards is determined by the column sequence. The first column is the primary sort, the second column is the secondary sort and so on. To change the sort order, re-arrange the columns.
Note: while there is a sort command on the quick menu, it does not work with the Finance dashboards.
Include and Exclude Columns
If after reviewing the report views available under the Select View drop-down, you determine that you'd like to remove a column or include a column that is not present, you can easily make those changes.
Exclude a Column
Right-click on the column heading and select Exclude column from the quick menu.
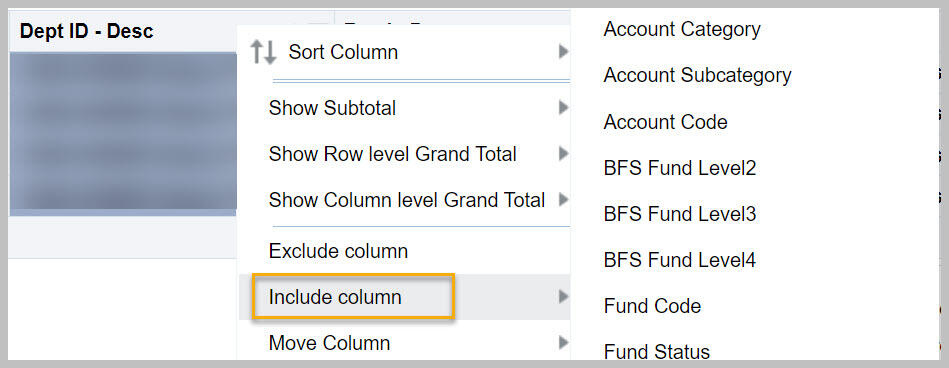
Include a Column
With your mouse on the heading of the column to the left of where you want to insert a column, right-click and select Include column from the quick menu. Select the column you want to include. Repeat this process for each column you want to add.
Column Selectors
Several of the older Student dashboards allow you to select the fields to be included in the results, providing another way to customize the data tables displayed. You can still include, exclude, sort, and move columns as usual; column selectors are just an additional way to get the table that you want.
Add Subtotals or Totals
You can show sub or grand totals by right-clicking from the row or column you want to summarize and selecting the appropriate command. For each of these commands, you'll select where the total is displayed, either before or after the value that is being summarized.
- Show Subtotal subtotals the value in the column you click to subtotal
- Show Row level Grand Total shows the Grand Total for the table
- Show Column level Grand Total shows the Grand Total for each numeric column; this may not be relevant for Financial dashboards
If you have added subtotals or grand totals and no longer want them, right-click on the column heading, select the appropriate total item from the menu and then select None.
Break a Report into Sections
If you have a large report, you may want to break it up into sections so that it is easier to manage. Cal Answers has two ways to do this.
- Move Columns to Sections - This functionality creates a separate section in the report for each value in the column. If you move the DeptID column to sections, Cal Answers creates a section heading for each Dept ID and then lists the data for that Dept ID. This is a helpful feature when you have a handful of values and want to see each value in its own table.
- Move Column to Prompts - When you move a column to a prompt, the person running the report can select the value for that column and the report will include only the rows that match the value selected. This is a helpful feature when you have many values and want to examine each of them in bite-size pieces. Note: if you move a column with too many members to prompts, the system may time out. For example, columns such as Dept ID, Account, and Fund have a limited number of members whereas columns such as Description and Reference may have thousands of unique members.
Move Column to Sections
Right-click on the column you want to move and select Move Column \ To Sections from the quick menu.

Move Column to Prompt
Right-click on the column you want to move and select Move Column \ To Prompt from the quick menu.

Move Column to Rows
If you have moved a column to a section or a prompt and decide that you'd like to have it in the table, hover your mouse over the column name, right-click and select Move Column \ To Rows.
What's Next
In the next chapter, Work Efficiently, we'll learn how to save these customizations so you can reuse them and share your reports with others.
Watch and Learn
Video: Changes You Can Make to Tables (3 minutes)
Practice
From the exercises you opened in Chapter 3. Select Prompts, complete Exercise 2 to practice these skills. The skills you will practice are the same but the dashboards used are different for each subject area.