Getting Started With Cal Answers
How do I clear my browser cache?
First, make sure you log out of Cal Answers. Then proceed.
An easy way to clear your cache is to go to your browser's history and delete it. You can choose whether to delete saved passwords and other data or just delete your browsing history.
- In Chrome, press [Ctrl + Shift + Delete] and choose "cached images and files" from the pop-up window. Set it to clear from "the beginning of time", then select "Delete data."
- In Firefox, press [Ctrl + Shift + Delete] opens a pop-up window that will let you select which time range to clear. select only 'Temporary cached files and pages.' After you clear your cache, wait a couple of minutes and then log into Cal Answers again.
Access
Who has access to Cal Answers?
Most faculty and staff members have automatic access to the Cal Answers Global Dashboards, which include most of the Student Data dashboards. See Getting Access to Cal Answers for details about checking your current access and requesting access.
How do I find out if a colleague or customer has access to Cal Answers Financials?
Before helping a colleague or customer request access, please check if they already have access. See Getting Access to Cal Answers Check Current Access for more information.
Log In
How do I log in to Cal Answers?
From the Cal Answers website, click the Log in to Cal Answers link under Quick Start in the upper left corner and enter your CalNet ID and Passphrase.
What do I do if I unsuccessfully try to log in too many times?
After five consecutive invalid login attempts, your account will be locked. Your account will be released/reset after 30 minutes, so try again then.
Will my Cal Answers session end after a certain time?
After a couple of hours, you will need to log in again and start over.
If you are in the middle of using a dashboard, you can save it as a bookmark link or saved customization before leaving it unattended for more than a couple hours so that you can go back to it.
Training Resources
- Self-study course: Cal Answers Basic Navigation: Work Efficiently
- Job Aid: Customizations and Bookmarks
- Video: Customize Your Reports
Cal Answers Application
Which internet browsers are compatible with Cal Answers?
See Browser compatibility for details.
Can I use Cal Answers to update data and transactions?
Cal Answers is a reporting tool and not a transactional system for making changes. To update data and transactions, go to the system that is the source of the data. The Cal Answers Planned Data Refresh Schedule shows data sources for each subject area.
Generate a Report
Filters and Prompts
How do I select multiple filter values in the dashboard prompts at the same time?
Single vs. Multi-Select
Prompts with a checkmark allow you to select one value.

Prompts with checkboxes allow you to select multiple values.

Enter Multiple Codes or Numeric Values
When you want to select multiple numeric values and you know the codes, it isn’t necessary to select them from a drop-down list. You can type or paste them into the prompt separated by a semi-colon. Do not use spaces. To select the Dept IDs 10060, 10070, and 10075, you can type or paste 10060;10070;10075.

To select multiple values with text, or when you don’t know the exact spelling of the values you want, use the Search functionality by clicking More/Search at the bottom of the drop-down list.
Use Search to Select Values
When you click More/Search… at the bottom of a prompt drop-down list, the Select Values dialog box opens so you can search for values. This is helpful when you need to select values with text and you're not sure of the spelling or you want to select multiple values easily.
This example uses the Action Reason – Desc prompt from the Workforce Detail dashboard. Our objective is to find employees who have had a promotion or a merit increase. First we'll search for values with "promotion" in the text.
- Type “promotion” in the text box.
- Select >> to move all of the results to the Selected pane. (If you wanted some but not all of the results, you could select the desired items and click >.)
- Do not select OK yet. The next step is to search for values with "merit" in the text.

The next step is to search for values with "merit" in the text. The Select Values dialog box should be open and have the promotion values in the Selected pane on the right.
- Type “merit” in the text box.
- Select AMR – Academic Merit/Reappointment from the search results.
- Select > to move only the selected item to the Selected pane.
- Select OK to complete the selection.

How do I select all of the options in the prompts?
If the drop-down list includes All Column Values, select that option.
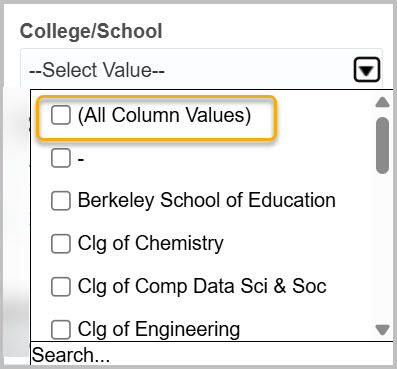
If the drop-down list has checkboxes, you can check all of the boxes. When there are many boxes, select Search at the bottom of the list of open the Select Values dialog box.
In the Select Values dialog box, select the >> button to move all of the values presented to the Selected pane on the right and then select OK to accept the selection.

How can I quickly reset or clear dashboard filters without selecting each one individually?
Select the Page Options button at the top right under your name.

Select Clear My Customization to restart from a blank slate.

Work with Reports
View Reports
How many rows can I display in a report?
Display
Cal Answers initially displays the first 25 rows in a report. You can use the up and down facing caret buttons below the report to move to the next or previous 25 rows.
Or you can select the Display all rows button, highlighted below, to display up to 5,000 rows. Then the next and previous buttons will work in increments of 5,000 rows.

Export
Cal Answers can export up to 120,000 rows of report data.
Customization
How do I sort data in dashboard tables?
To sort the data in a column, move your cursor over the column header click the up or down arrow to sort in ascending or descending order.
For greatest flexibility in sorting multiple columns, you may want to export to a CSV file and then sort within Excel.
Watch the video: Changes You Can Make to Tables to see a demo.
How do I move a column in a data table?
- To move a column to the left or right, right-click the column header and select Move Column. Then select Left or Right.

- If you want to move a column a greater distance, the drag and drop functionality is efficient. Move your cursor to the column header until it displays the four-headed navigation arrow. Then hold the mouse button and drag along the column headings until you see a light blue column in the place where you want the column to land. Release the mouse button.

Training Resources
- Self-study: Cal Answers Basic Navigation: Customize Reports
- Video: Changes You Can Make to Tables
How do I delete a column from a data table? How would I add it back?
To remove a column, right-click the heading of the column you would like to delete and select Exclude Column.

To display an excluded column, right-click on the heading of the column to the right of where you want to insert the column and select Include Column. Then select the column you want to include.
Training Resources
- Self-study course: Cal Answers Basic Navigation: Customize Reports
- Video: Changes You Can Make to Tables
How do I save a view that I have customized in Cal Answers so I can use it again?
Cal Answers allows you to save one or more customizations with a dashboard report. A customization includes filters you have applied as well as changes you made to the report table.
To share a customization with other Cal Answers users, you can create a bookmark.
Training Resources
- Self-study course: Cal Answers Basic Navigation: Work Efficiently
- Job Aid: Customizations and Bookmarks
- Video: Customize Your Reports
Can I save my filter settings and other formatting changes I've made to the data tables so I don't have to reenter them each time?
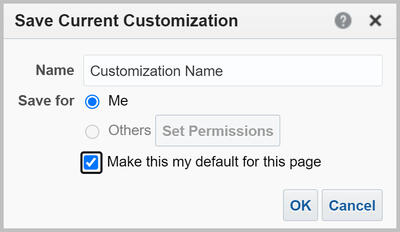
Yes. Once you’ve applied the filters and formatting changes to the data table, click the Page Options icon in the upper right corner of the Cal Answers report window and select Save Current Customization from the menu.

Enter a name for the customization and select OK to complete the task.
When you return to this dashboard page and would like to apply the customization you have previously saved, go to the same Page Options menu and select Apply Saved Customization to bring up that particular filtering criteria or data set you would like to work with.
If you’d like to have this customization applied whenever you open this report, check the box to Make this my default for this page when you create the customization. If you’ve already created a customization without making it the default, you can edit the customization. From the Page Options menu, select Edit Saved Customizations.
Training Resources
- Self-study course: Cal Answers Basic Navigation: Work Efficiently
- Video: Customizations and Bookmarks has step-by-step instructions on saving, applying, editing and removing your customized dashboard views.
Drill-Down
Where did my Page Options button go?
The Page Options icon does not show when you are in a drill-down report. Below the report in the bottom left corner of the page, links are available for many of the page options.

If you are not in a drill-down report, it is because you have Accessibility Mode turned on. To turn it off:
1. Go to Signed in As [your name] at the top right and click on your name.
2. Select My Account. In the Preferences tab, Select Off for the Accessibility Mode.

3. Select OK.
4. Refresh your browser tab.
5. If that doesn't work, log out and log back in. The button will be present.
Bookmarks
Someone sent me a bookmark link but when I try to open it, I get an error message.
You may not have access to the report, or you may have access but not to the data in this specific report. See Getting Access to Cal Answers for details about checking your current access and requesting access. If you have access, then it may be a technical issue with the bookmark link. Please email calanswers-help@berkeley.edu.
Can I share a filtered and formatted dashboard with a colleague?
You can create a custom URL or Bookmark Link in Cal Answers. Check out our Customizations and Bookmarks Job Aid for step-by-step instructions for creating, sharing and accessing a dashboard bookmark link.
Training Resources
- Self-study course: Cal Answers Basic Navigation: Work Efficiently
- Job Aid: Customizations and Bookmarks
- Video: Customizations and Bookmarks
Why does my colleague see different data than I do with the same prompt selections or with the bookmark link that I sent them?
They have access to a different subset of data than you do. This applies to the Student Data and HR dashboards that requires additional access, where access is specific to the department or org node. This does not apply to the Finance, Payroll, and global dashboards, where access is global.
Concurrent Analysis
Can I run a concurrent analysis without leaving my current one?
This is helpful when you need to compare two different sets of results within the same dashboard. You can create a bookmark link and open it in a new tab.
You can also open a new tab and go to calanswers.berkeley.edu to go to another dashboard.
Training Resources
- Job Aid: Customizations and Bookmarks
- Self-Study course: Cal Answers Basic Navigation: Work Efficiently
I get an error when attempting to print a PDF. What can I do?
If you get the "Invalid queryID string Error Details Error Codes: GKEIW7NN" error message when attempting to print to a PDF using the Chrome browser, there are two possible workarounds:
- Remove or disable the Adobe extension in Chrome.
- Run Cal Answers on a different browser such as Firefox so you can print to a PDF.
How can I print an entire report page from Cal Answers?
-
Below the report, there is a Print link. This link prints the data table and filter key.
-
The Page Options button has a Print command that prints the data table and filter key along with the filters/prompts section from the top of the dashboard page.

Training Resources
Export
Can I export data?
When you click the Export link below the report, a menu of export formats is presented.

To export the raw data for further analysis, select the Data option at the bottom of the menu. The Comma Separated Value (CSV) Format is recommended. This selection downloads all of the columns available in the report, even if they do not appear in the data table.
For a formatted report, select PDF or Excel.
Training Resources
- Self-study course: Cal Answers Basic Navigation - Print and Export Reports
- Job Aid: Printing and Exporting
- Video: View, Print, and Export Reports
How many rows of data can I export?
The maximum is 65,000 rows. If you notice your export has exactly 65,000 rows, it is likely some rows have been omitted from the export. You may want to run your data in batches.
How can I export a customized report in an Excel or PDF format?
Once you have run a report, you can export the formatted report to a PDF, Excel or Power Point file. All of these selections give you a What You See Is What You Get (WYSIWYG) presentation that cannot be edited without significant effort.
Select the Export hyperlink below the report to access the choices to export a formatted report or data in various formats.

Data
Where is the data in the reports coming from?
See the Cal Answers Planned Data Refresh Schedule for the data sources of the reports.
How can I open a downloaded file in Excel without dropping leading zeros?
When you open a comma separated values (CSV) file in Excel, you will be asked whether you want Excel to remove leading zeros. Select Don’t Convert to keep leading zeros.

When is new data uploaded to Cal Answers from the source systems?
The Cal Answers Planned Data Refresh Schedule provides an overview of the planned timing for when new data is to be added to each subject area within Cal Answers on a recurring basis.
Support
Where can I find report documentation and data dictionaries for each of the student data subject areas?
The Overview tab of each dashboard has links to wiki documentation that explains the dashboard reports and a data dictionary that explains the columns used in the prompts and reports.
In addition, the Wikis page has links to the Wiki pages organized by subject area.
Note: you must be connected to Eduroam or GlobalProtect to access the Wiki documentation.
Who can I contact for questions or feedback about Cal Answers?
The Cal Answers Help Desk is available Monday through Friday from 8 AM - 5 PM, except university holidays.
You can also make an Office Hours appointment to meet with a Cal Answers expert to get your specific data questions answered. Check out the Office Hours section on the Cal Answers website for more information.
What is the schedule for application availability and support?
Cal Answers is available Monday-Friday from 8am to midnight.
See System Availability and Support for details about when Help Desk support is available.
Student Data
How does Cal Answers handle historical data when academic units move?
When a unit moves in the campus academic hierarchy (for instance, a department might move to a different college), all of that unit’s historical data moves along with it, so that trend analyses will continue to work.
Does the Summer term lead or trail in the academic calendar?
The Summer term leads in the UC Berkeley academic calendar. For example, the 2024-25 academic year consists of Summer 2024, Fall 2024, and Spring 2025.
Note that the Financial Aid Year treats Summer as a trailing term, however. For example, the 2024-25 financial aid year consists of Fall 2024, Spring 2025, and Summer 2025.
Which student data dashboards and reports include graduate student data?
Most of the student dashboards include graduate student data. However, these dashboards in the Student Demographics & Outcomes subject area do not show graduate student data:
- Graduation, Retention and Time to Degree
- Multiple Majors
Check out the Cal Answers Student Data Subject Areas, Dashboards and Filters Map job aid. Reports with an * include undergraduate data only. All other reports include both Graduate and Undergraduate student data.
Student Curriculum
Where can I see what Majors are taking my courses?
You can use the Student Curriculum -> Students & Courses dashboard -> Majors in Courses report to see Course Enrollment counts grouped by major for the filtered College/School, Division, Department, Course Subject, Course and/or Course Section.
What is the difference between the CEN and EOT Snapshot filter options?
A snapshot refers to a particular point in time at which Cal Answers extracted data from the source system.
- The Census (CEN) snapshot happens every Fall and Spring semester on the 25th day of instruction (10th day of instruction for Summer sessions). This is also the deadline for undergraduates to add or drop classes.
- The End of Term (EOT) snapshot is taken at the end of the academic term after grades have been submitted. It includes the students who were registered at that time regardless of whether they have been counted in the Census snapshot.
Training Resources
- Wiki: Snapshot
- Wiki: Students & Courses
Curriculum Long Term Planning
Can I find Summer Session (A, B,C, D) course enrollments counts over the past several years in Cal Answers?
To see summer session enrollments, go to the Curriculum Long Term Planning Dashboard, Course View Report. Select the summers you want using the Year and Semester filters and the summer session you want to view in the Session Nbr filter.
Note that you will not be able to see course from a single summer session (e.g. Session A), the CEN and EOT snapshots combine all sessions.
Weekly Enrollment Manangement
Can I find concurrent enrollment data in the Cal Answers Student Data dashboards?
Currently, there is no concurrent enrollment data in the Cal Answers Student Data dashboards. This information is available in Campus Solutions reporting.
How do I work with the Snapshot weeks (- and +) in the filter section of the Weekly Enrollment Dashboard ?
Weekly snapshots range from Week -30 to Week +18. These refer to the weeks leading up to the start of the semester and through to the end of the semester. Week 0 contains the official start day of the semester, and Week +01 contains the first day of instruction. Weekly snapshots are taken on Saturday morning of every week during the year.
We have additional resources available if you would like to learn more:
Student Demographics & Outcomes
Can I find out the demographics (gender, ethnicity, residency status, etc.) of the students taking my courses?
Although there isn’t a Cal Answers global dashboard that displays student demographic information by course, there is a restricted dashboard (i.e., “Demographics in Courses”) that users may request access to via the “Student Restricted” role, as described on the Cal Answers Access webpage.
Where can I find international student counts within the Student Data dashboards?
Within the Undergraduate Applicants and Student Demographic & Outcomes subject areas, you can find International Student counts by filtering for 4-Value Ethnicity (or any of the ethnicity fields), not Residency Status.

Multiple Majors
Can I find the count of students with multiple majors on campus, as well as their combination of majors?
Yes, the Multiple Majors dashboard includes tabs that report on the count and percentage of registered undergraduates with multiple majors for the UC Berkeley campus as a whole as well as for each undergraduate major program.
You can learn more on the Cal Answers Student Demographics and Outcomes Multiple Majors section on our website and also from our Multiple Majors Dashboard Wiki report documentation.
UG Grad Rates
Can I find graduation rates for the College of Chemistry for both Freshman and Transfer students?
Yes, from the Student Demographics & Outcomes subject area, open the Graduation, Retention & Time to Degree dashboard and click on the UG Grad Rates report tab.
1. Make the following selections and then click Apply:
-
Year and Semester
-
Entry Status: New Freshmen (Because you can only select one entry status, you must run the report twice, once for New Freshmen and then again for Transfer students.)
- Entry College: select your college or school

2. Because you can only select one entry status, you must run the report twice, once for New Freshmen and then again for Transfer students.

3. Select Transfers from the Entry Status prompt and click Apply to generate the report for Transfer students.
Graduation Rate Data Consideration
The graduation data in this dashboards is based on entry college (as of the end of students‘ first regular semester--i.e., not summer if the student took part in a summer program prior to matriculating) and NOT based on exit college.
What this means then is that the College of Chemistry receives graduation rate "credit" for any student who enters the College of Chemistry and graduated from UC Berkeley, even if that student switched colleges. However, this goes both ways. That is, students who leave the College of Chemistry and then drop out or stop-out will be factored into the College of Chemistry graduation rates. Finally, students who flow into the College of Chemistry after the end of their first term at Berkeley are also not captured in the College of Chemistry's graduation rates.
If you are interested in both the inflow and outflow of students by college, please see the Major Migration & Persistence graphic that is outside of Cal Answers
Note that the undergraduate time to degree data, which is shown on the last tab of the Graduation, Retention & Time to Degree dashboard represents a set of metrics that are based on degree recipients (i.e., an "exit cohort" of students). Thus, that data is only for College of Chemistry degree recipients.
UG Retention
Can I find retention rates for the College of Chemistry in Cal Answers for both Freshman and Transfer entrants?
Yes, from the Student Demographics and Outcomes subject area navigate to the Graduation, Retention & Time to Degree dashboard and choose either the UG Retention or UG Retention by Multiple Fields tab to pull the latest retention rates (1-yr, 2-yr, 3-yr, etc.) for freshmen and transfers who entered in the College of Chemistry.

Graduation, Retention & Time to Degree Dashboard, UG Retention Report filtering section
Filtering selection includes prompts for:
- Entry Year & Semester
- Entry Status - New Freshman or Transfer
- Gender - Decline to State, Female or male
- Residency -Nonresident or Resident
- 4-, 9-, or 16-Value Ethnicity - includes International
- Entry College - 5 undergraduate colleges and Haas
Cal Answers
Why is Cal Answers important?
The tool ...
- Helps us make better decisions as we assess new opportunities, set priorities, and deal with resource constraints.
- Allows us to communicate more clearly as we have one set of facts and definitions. We have worked extensively with data providers to ensure that these are the best answers to use in the topics addressed.
- Provides metrics that are critical to managing and monitoring progress towards meeting our goals.
- Helps fulfill the goal of the Institutional Data Management and Governance initiative (IDMG) to make campus data easily accessible, reliable, consistent, and secure to support informed planning, decision-making, and communication.
What are key features of Cal Answers?
Cal Answers provides interactive dashboards and reports, allowing you to see information about the entire campus and drill down to specific departments or other subsets of data. You can rearrange or delete data columns, sort by different parameters, and filter the data in different ways so the tool meets your needs. If you want to go further, you can develop your own reports and dashboards within the Student Demographics and Outcomes subject area.
PI Portfolio
How do I get access to PI Portfolio?
Faculty have automatic access to data for the funds they manage and can log in using their CalNet login ID. If you are not a faculty member, you can request access. See Getting Access to Cal Answers for details on requesting access to PI Portfolio.
How do I log in to PI Portfolio?
Log in to Cal Answers. Once on the home page, go to the Financial Dashboards section. Expand the PI Portfolio subject area by clicking on PI Portfolio or the + on the right. Then click PI Portfolio.
Can you have two windows open at the same time in PI Portfolio?
Yes, you can open two PI Portfolio reports in two tabs within the same browser window, but it works more consistently if you open each in their separate browser window.
What kind of projections can I input in PI Portfolio?
You can input projections for Anticipated Funding, Compensation and Non-Compensation expenses using the CF2 of the selected faculty member.
Is there an easy way to filter for non sponsored awards when working in the different tabs?
Use the Portfolio report to identify the funds as Sponsored or Non-Sponsored. There is no indication in the other reports.
How can I select all funds to view?
March 14, 2016
You can either deselect the fund you’ve chosen so that none are selected, or select all, then Apply. Either will make all the funds show up.
In the Personnel tab, do wage lines show gross or net pay?
March 14, 2016
They show gross pay only. Net pay is not available in PI Portfolio.
Can I see the name of the BearBuy cart owner who made the purchase in the transaction detail?
March 14, 2016
Not at this time. It shows the person being paid. If it’s a reimbursement, you would see the person’s name. We’ve logged this as a future phase request.
What is the last closed period?
March 14, 2016
The last closed period is the last month that has been officially closed on the ledger in BFS. A closed month may be considered completed for reporting purposes. A month that is not closed may still have unposted activity, often including payroll. Payroll typically posts 7-10 days after the pay period end date, so a typical fiscal month will close about ten days to two weeks after the end of the month on the calendar. Projections are replaced by Actuals after the month closes.
What is a CF2?
March 14, 2016
The CF2 is part of the chartstring that identifies the Principal Investigator (PI) or faculty lead for the fund. The chartstring is the who/what/where/when/why – it includes Fund, DeptID, Account, CF1, CF2, Program. Total award actuals will show the whole fund. The lead PI sees all the transactions, an individual PI only sees transactions related to their CF2. See the chartstring page on the PI Portfolio website for more information.
Why are projections based on my CF2?
March 14, 2016
The CF2 is used to uniquely identify activities that "belong" to you. A CF2 is unique to a PI, and is issued as a control point for PIs in approving expenditures, and as a "handle" for effort reporting. You can find out more about what a CF2 is, chartstrings, and Chart of Accounts (COA) on the PI Portfolio website.
What is a projection in PI Portfolio?
A projection is an anticipated expense or funding you indicate to get a more accurate ending balance for the fund. This helps you plan out spending. A projection is a single row in the Input Form, which is given an ID# once you Apply Changes. The same ID# will be used for corresponding auto-projections such as Overhead, CBR and GAEL.
How do I look up a chartstring in PI Portfolio for a specific account?
March 14, 2016
You can view all the past actuals in the transactions tab, which shows you the full chartstring if you select "full chartstring" as an option in the view selector. In the projections input form, predictive type can help you choose the appropriate value for each chartfield. If you choose an expense type first, it will limit the accounts in the dropdown list to those that roll up to that expense type.
How do I look up a chartstring in PI Portfolio?
March 14, 2016
You can view all the past actuals in the transactions tab, which shows you the full chartstring if you select "full chartstring" as an option in the view selector.
Can I see an entire chartstring?
March 14, 2016
For actuals you can view the full chartstring in the Transactions tab. You can view all chartfields except the Project Costing (PC) fields for projections. This includes data from across Berkeley -- multiple departments and schools as well as multiple CF2's if the Principal Investigator (PI) has them.
How frequently will projections be updated in PI Portfolio?
March 14, 2016
CSS RA's will review and update projections as necessary as part of the monthly reporting and reconciliation process.
Who fills out the projected expenses in PI Portfolio?
March 14, 2016
Projected expenses should be filled out by a faculty member's Research Administrator (RA) or designated support staff.
Can I use PI Portfolio if I don't use Contracts and Grants funds?
March 14, 2016
Yes, you can make projections for Non-Sponsored Funds if they use a faculty-attributed CF2.
Could I use an interactive form of Excel to scenario plan?
March 14, 2016
You can use Excel to scenario plan by downloading the data and manipulating it in Excel on your own.
Is there a way to go back in time and see portfolio balances at a previous date?
March 14, 2016
You can look by fund since the inception to date but you cannot see a whole portfolio back in time; such as “Where was I five years ago”. This is logged as a future request.
Can I save an incomplete projection in PI Portfolio and go back and finish it later?
March 14, 2016
The system only saves complete projections, so each line must be completed in order to "Apply Changes." You can then leave and return later to add additional projections. If you add blank rows, they will be automatically deleted when you apply changes as long as you have not started to fill in the fields. Once you start to complete a row, you must finish and Apply Changes or cancel. You can always delete a projection after you have Applied Changes.
Can I revert back to an earlier projection scenario in PI Portfolio?
March 14, 2016
No, this is considered scenario planning and is not included in this phase of the project. Actuals will replace projections over time. You can archive a set of projections to be viewed at a later date, but you cannot revert back to using these saved sets of projections in the dashboard reports. You can download the data to Excel or PDF but you cannot "reapply" an old set of projections. Only the active projections are used to calculate fund balances.
Can the Burn Rate report be used to project supply costs?
Yes. The burn rate report was created for this purpose. You can view the average monthly rate, see how much of that is made up of supply costs and use that to project future supply costs.
Note the burn rate applies only to the activity for the PI, as defined by all the transactions posted to their CF2(s). If a fund has multiple PIs, the other PI's transactions aren't calculated into the burn rate.
What does "Burn Rate" mean?
March 14, 2016
Burn rate means the average monthly expense rate. For the purposes of PI Portfolio, it means the average monthly actuals amount for each chartstring used by the faculty member.
Is there an easy way to filter out certain Dept IDs when running reports in PI Portfolio?
You can right click the Department column header and select "Move" then "To Prompts" which will move the column above the table as a drop down filter. Use this drop down to filter the results by Dept ID. This feature only allows you to look at one department at a time. We have logged a flexible department filter as a future enhancement request.
Can I sort by transaction in PI Portfolio?
March 14, 2016
Yes, you can do this by right clicking the column header and choosing sort. This is the case for most columns in Cal Answers.
What will the PIs and RAs see in the enhanced dashboard?
March 14, 2016
In the enhanced dashboard, Principal Investigators (PIs) and Research Administrators (RAs) will see projections added to the existing Portfolio, Personnel, and Fund Summary tabs. There are also three new tabs; Projections, HR Lookup, and Burn Rate. You can find out more about the enhanced dashboard on the PI Portfolio website at: calanswers.berkeley.edu/pi-portfolio/about-pi-portfolio.
Can I upload PI Portfolio projections to CalPlanning?
No but you can export projections to Excel. You can then aggregate the amounts and enter them in CalPlanning.
When do new awards appear in PI Portfolio?
As soon as a fund number has been assigned and budget is uploaded and approved by Contracts and Grants Accounting (CGA) in BFS. You can check the status of an award in Phoebe
Can you group or rename the funds on the Portfolio tab?
March 14, 2016
Not at this point. We’ve added this as a suggestion for the next phase.
Can the current funds in PI Portfolio be renamed?
Funds are shared across faculty and departments so only the BFS official fund name is shown. It is not possible to change the name in PI Portfolio but this can be done through BFS.
How can the closed funds still in PI Portfolio be addressed?
PI Portfolio is a reflection of BFS. When the funds are fully closed in BFS, they will no longer appear in PI Portfolio. Please ensure all transactions have posted and all Purchase Orders have been closed, and then work with your RA and Contracts and Grants Accounting (CGA) to close these funds. How can the closed funds Q- replace last sentence with Find more information on how to close an inactive fund.
How are encumbrances calculated in PI Portfolio?
March 14, 2016
Encumbrances represents the remaining balance of a Purchase Order (PO). When a PO is created, the full amount is "encumbered" meaning it is subtracted from the current fund balance to show that this amount has been earmarked for this specific purpose. Once the actual posts, the encumbrance amount is reduced to zero (if the purchase is complete) or to the remaining amount on the PO for outstanding purchases not yet posted to actuals but still expected to occur.
How are encumbrances shown in PI Portfolio?
March 14, 2016
They are displayed in all views and are subtracted from the fund balance.
Is the data in PI Portfolio accurate?
Yes, the data in PI Portfolio comes from the EDW (Enterprise Data Warehouse). The EDW is updated nightly with data from BFS. If you see an error, it needs to be fixed in BFS to reflect correctly in PI Portfolio.