Most of the student dashboards include graduate student data. However, these dashboards in the Student Demographics & Outcomes subject area do not show graduate student data:
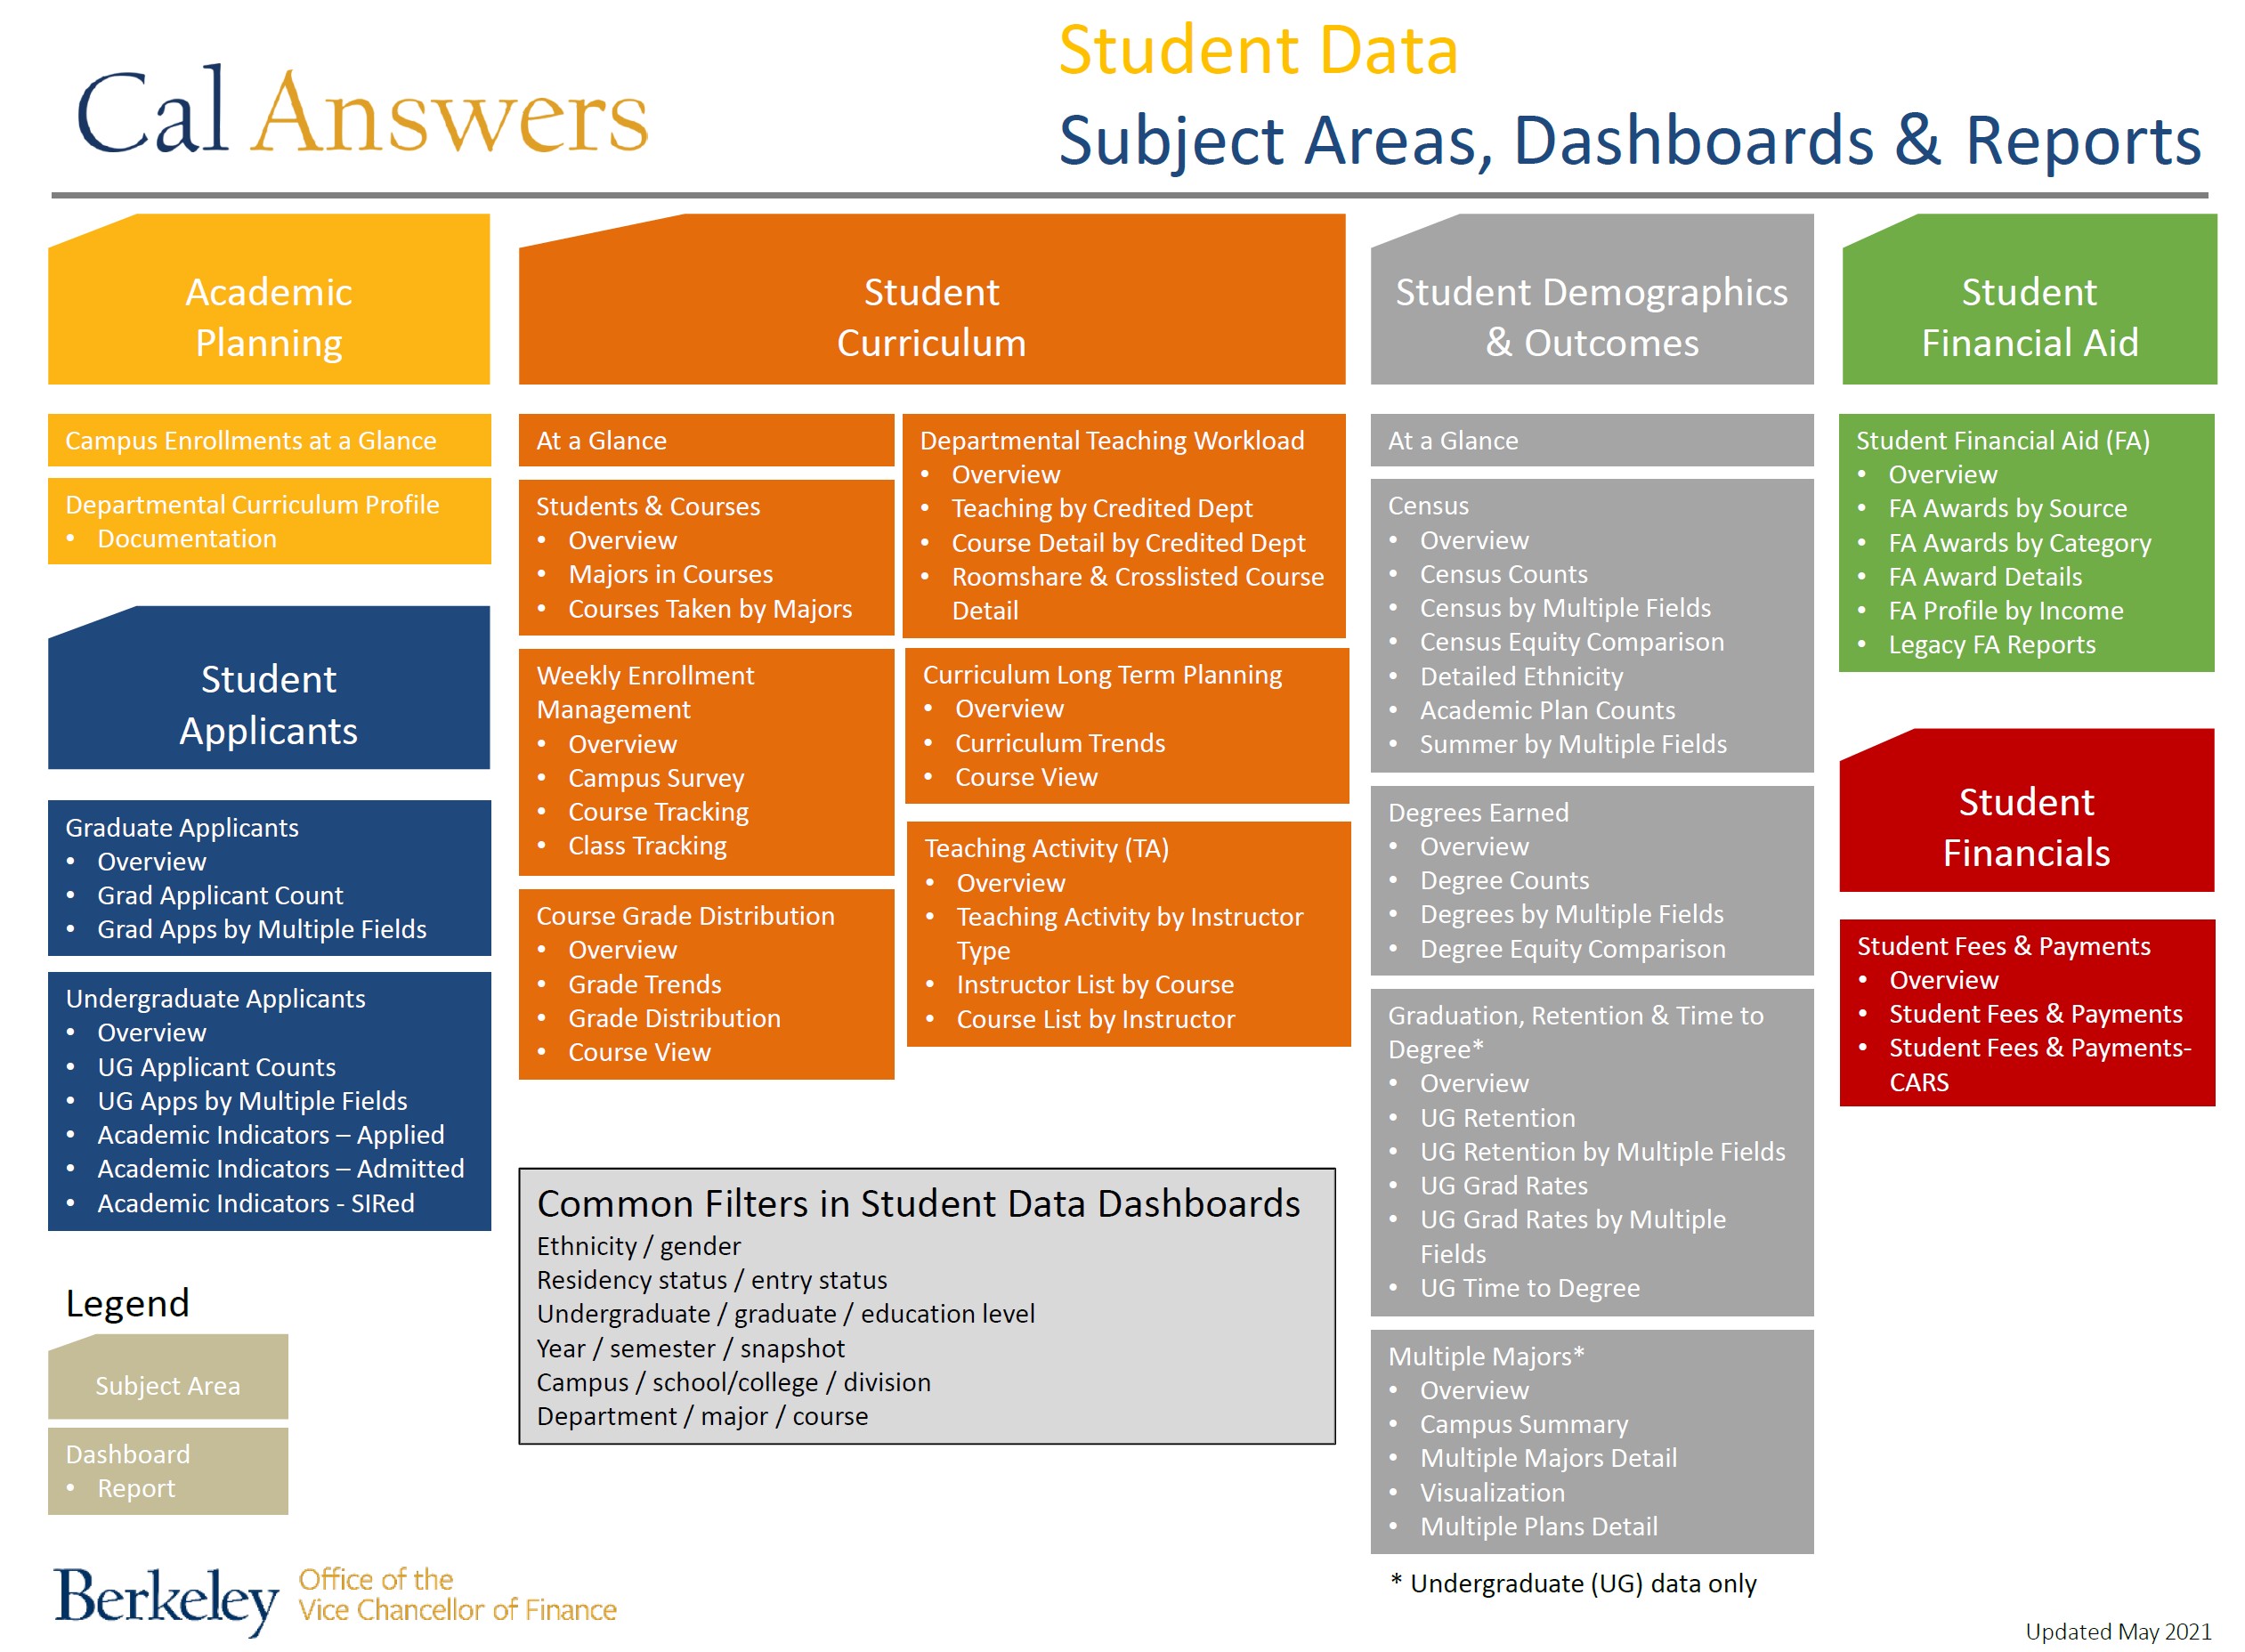
Student Data dashboards provide Cal Answers users with the ability to view and analyze student data in order to answer questions and improve decision making. The student data dashboards currently available in Cal Answers are:
Currently, there is no concurrent enrollment data in the Cal Answers Student Data dashboards. This information is available in Campus Solutions reporting.
Weekly snapshots range from Week -30 to Week +18. These refer to the weeks leading up to the start of the semester and through to the end of the semester. Week 0 contains the official start day of the semester, and Week +01 contains the first day of instruction. Weekly snapshots are taken on Saturday morning of every week during the year.
We have additional resources available if you would like to learn more: